Total demand is a useful tool for thinking through economic problems. Unfortunately, modern textbooks drop it completely. Searching through MWG, baby Varian, real Varian, Hirschleifer, David Friedman’s Price Theory, and McCloskey’s Applied Price Theory, I find no reference to this concept. It could be mentioned in passing in one of these books, but I did not find it today nor notice the idea when I have read through these books in the past.
When I say total demand, I do not mean the demand of all consumers added together. That would be total consumer demand. I mean TOTAL demand, the demand of all people and not just those economics define as “consumers.” Most authors do not see a difference, because they make the shortcut of dividing the population into producers and consumers. That division has many benefits, but it also has costs. The loss of total demand is one downside.
While I do not blame those authors for cutting the concept (book space is limited), I would like to elaborate on total demand here on the interwebs without space constrictions.
Producer Demand?
The difference between total demand and total consumer demand is the producer demand. Wait, I thought producers supply, not demand. Again, econ often works in this dichotomous world. Producer demand is obvious from a simple point, producers do not sell at any price.
I cannot go to the BMW dealership and offer $1 for the new i8. Why not? Because the producers also demand the car and their demand is above mine. By forgoing the dollar that I offer them, they are effectively buying the car for $1. If they did not demand the i8, they would sell it for any price and it was up to customers to bid it up from $0.
This concept can be illustrated using a graph similar to the standard supply and demand. Here total demand is TD. It consists of consumer demand (D) and supplier demand (which is a reverse of supply, S). The equilibrium price is where the total demand (TD) equals the total supply (stock), not just the standard supply. This supply is the amount that actually would exchange hands at a certain price. The TD/stock equilibrium price will be the same as the intersection of traditional D and S.
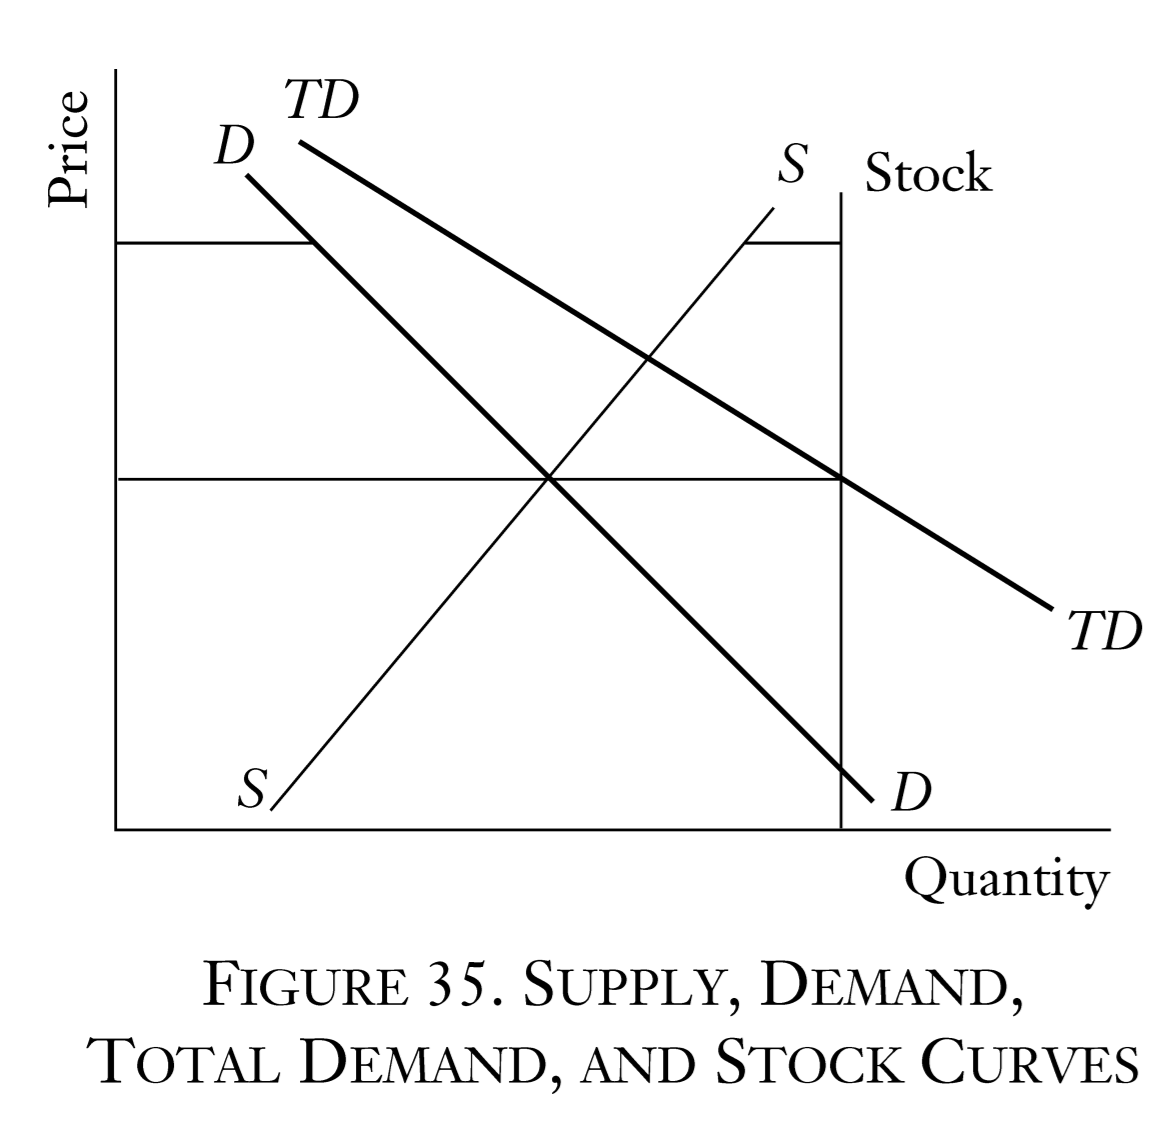
One downside of the TD/stock graph is that it does not show how much of the good actually exchanges hands, usually labeled Q*. The TD/stock graph looks the same if all the original holders of a good sell them or if none do.
But why does the number of goods that actually exchanges hands matter? The counter-intuitive point is that it does not really matter.
Economics as Toolbox
Economists often describe economics as a toolbox. It is a field of study that helps us understand the world. TD/stock curves are another example of how clear economic thinking can improve our understanding and help us avoid a few fallacies.
Some examples- Suppose only a few shares of a company trade in any day1. Skeptics will say that this does not reflect the “true” market price since the price would drop if many stocks came on the market. However, this drop would only happen in the current holders lower their demand to hold stocks. They will try to sell the stocks if the current market price is above their group evaluation of the “true” price. Instead, everyone who is holding the cash values it above the market price. An equilibrium price always reflects the price where total demand equals the stock. It is impossible for it not to.
Now, imagine a frictionless world where all goods are spread evenly across the population. People would exchange until every good was in its most highly valued use. Now, imagine a world where the goods are originally given to these most highly valued ends. No exchanges occur and we are in exactly the same result as the first world. Which of these two worlds is better? Which of these two worlds has a high Q* and thus a higher GDP? Keep that in mind anytime you look at data.
Let’s now use the two above examples to highlight a third, more common, fallacy. This one goes back to a long way, but was popularized by Keynes. Imagine there is a good, say money, which has a low Q* in any time period. Some would be tempted to say that this money is idle or not “flowing” in some sense. However, this does not show that the goods are idle or not serving their most valuable purpose. All goods are always possessed by someone. At any point, they are never “flowing.” In the case of money, a low Q* only shows that most valuable use of the money is in cash-balances in some period.
The question is not whether the money is idle, since it is obviously serving its most valuable purpose at the moment. Whether its most valued use is to those who had it last period or not is irrelevant. They are both the same thing.
Remember this anytime that you complain about companies or banks “hoarding cash.” The fact that Q* is small is not important. Instead, if worried, we should be asking why are banks holding money? What is the uncertainty that makes cash-balances the most desirable use of the money? Is it some distortion of incentives? Or is the world just naturally uncertain and banks want to hold money?
This does not mean that the world is perfect. Man is fallen. Instead, it means that given the state of the world, everyone buying and selling in the way that is best, according to their beliefs.
Again, clear economic thinking is key.
- This example comes from Stigler Theory of Price 4th Edition Page 90.